Understanding what scikit-learn is and how to use it is important, but there are a few other libraries that will enhance your experience.
Scikit-learn is built on top of the NumPy and SciPy scientific Python libraries.
In addition to knowing about NumPy and SciPy, we will be using Pandas and matplotlib.
We will also introduce the Jupyter Notebook, which is an browser-based interactive programming environment.
Briefly, here is what you should know about these tools in order to get the most out of scikitlearn.
The Jupyter Notebook is an interactive environment for running code in the browser.
It is a great tool for exploratory data analysis and is widely used by data scientists.
While Jupyter Notebook supports many programming languages, we only need the Python support.
The Jypyter Notebook makes it easy to incorporate code, text, and images, and all of this book was in fact written as an IPython notebook.
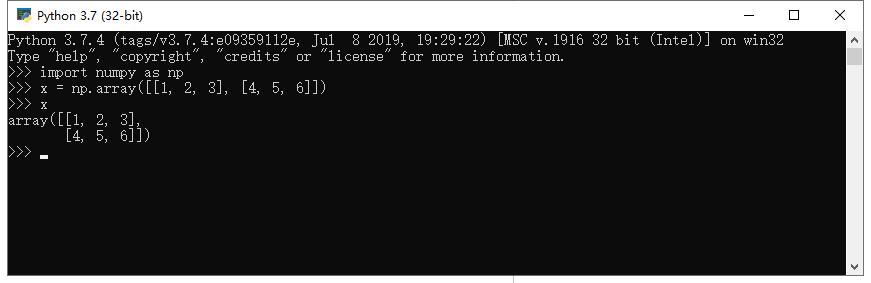
NumPy is one of the fundamental packages for scientific computing in Python.
It contains functionality for multidimensional arrays, high-level mathematical functions such as linear algebra operations and the Fourier transform, and pseudo random number generators.
The NumPy array is the fundamental data structure in scikit-learn.
Scikit-learn takes in data in the form of NumPy arrays. Any data you’re using will have to be converted to a NumPy array.
The core functionality of NumPy is this “ndarray”, meaning it has n dimensions, and all elements of the array must be the same type. A NumPy array looks like this:
It provides, among other functionality, advanced linear algebra routines, mathematical function optimization, signal processing, special mathematical functions and statistical distributions.
Scikit-learn draws from SciPy’s collection of functions for implementing its algorithms.
The most important part of scipy for us is scipy.sparse with provides sparse matrices, which is another representation that is used for data in scikit-learn.
Sparse matrices are used whenever we want to store a 2d array that contains mostly zeros:
|
from scipy import sparse # create a 2d numpy array with a diagonal of ones, and zeros everywhere else eye = np.eye(4) print("Numpy array:\n%s" % eye) # convert the numpy array to a scipy sparse matrix in CSR format # only the non-zero entries are stored sparse_matrix = sparse.csr_matrix(eye) print("\nScipy sparse CSR matrix:\n%s" % sparse_matrix) Numpy array: [[ 1. 0. 0. 0.][ 0. 1. 0. 0.] [ 0. 0. 1. 0.] [ 0. 0. 0. 1.]]
(0, 0) 1.0 (1, 1) 1.0 (2, 2) 1.0 (3, 3) 1.0 More details on scipy sparse matrices can be found in the scipy lecture notes. |
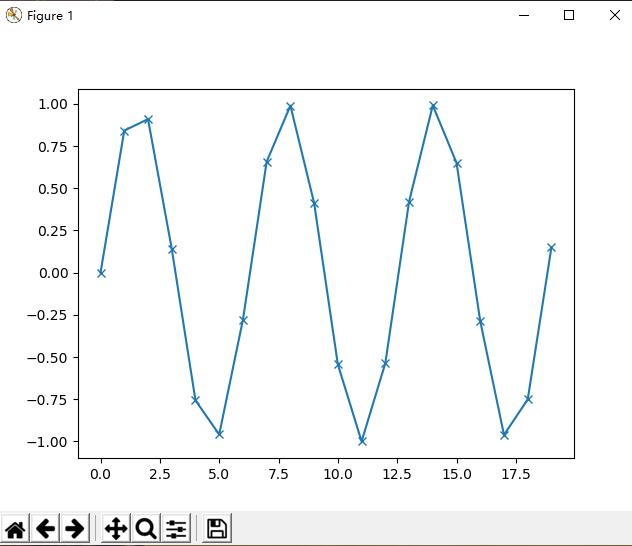
Matplotlib is the primary scientific plotting library in Python.
It provides function for making publication-quality visualizations such as line charts, histograms, scatter plots, and so on.
Visualizing your data and any aspects of your analysis can give you important insights, and we will be using matplotlib for all our visualizations.
|
import matplotlib.pyplot as plt
import numpy as np # Generate a sequence of integers x = np.arange(20) # create a second array using sinus y = np.sin(x) # The plot function makes a line chart of one array against another plt.plot(x, y, marker="x")
plt.show() |
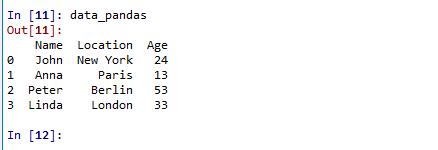
Pandas is a Python library for data wrangling and analysis.
It is built around a data structure called DataFrame, that is modeled after the R DataFrame.
Simply put, a Pandas Pandas DataFrame is a table, similar to an Excel Spreadsheet.
Pandas provides a great range of methods to modify and operate on this table, in particular it allows SQL-like queries and joins of tables.
Another valuable tool provided by Pandas is its ability to ingest from a great variety of file formats and databases, like SQL, Excel files and comma separated value (CSV) files.
Going into details about the functionality of Pandas is out of the scope of this book.
However, “Python for Data Analysis” by Wes McKinney provides a great guide.
Here is a small example of creating a DataFrame using a dictionary:
|
import pandas as pd # create a simple dataset of people data = {'Name': ["John", "Anna", "Peter", "Linda"], 'Location' : ["New York", "Paris", "Berlin", "London"], 'Age' : [24, 13, 53, 33] } data_pandas = pd.DataFrame(data) data_pandas |