Quantum Finance Forecast System
(QFFS)
Quantum Finance Forecast System (量子金融預測系統, aka QFFS)
is an innovative AI-based Fintech System for the real-time forecast of
worldwide financial products including worldwide forex, commodities (such as
precious metals, colour metals, crude oil, agricultural products) and all major
financial indices (such as HSI, DJI,Nasdaq,DX30, etc.).
With the integration of Dr Lee patented Chaotic
Neural Network Oscillators Technology (so-called LEE-oscillator) and Dr Lee self-developed
Quantum Finance Model (based on Quantum Field Theory) to produce Quantum Price
Levels (量子价位). Together with the real-time financial data
provided by KVB Kunlun Financial Group Ltd, QFFS converts traditional financial
signals & oscillators including: Bollinger Bands, KDJ, MACD, RSI into daily
High/Low forecast indices so-called Raymond Finance Forecast Indices (“Raymond
Indices 惠民預測指数” in short) of all financial products in the
worldwide volatile markets, with average daily forecast accuracy rate above 90%.
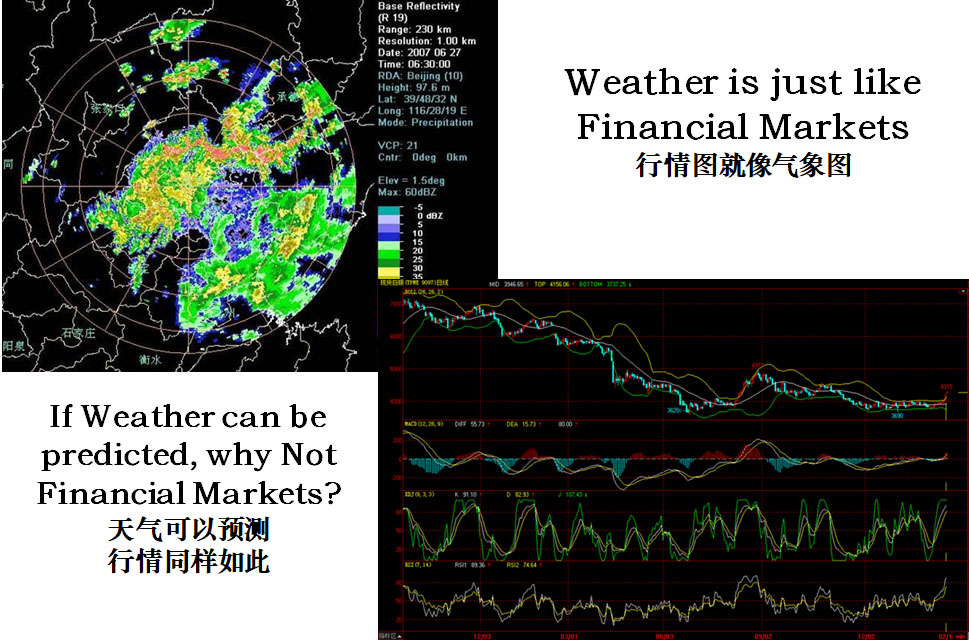
The financial market is like the weather, although changeable, but there are some laws to follow. Since the weather is predictable, so can the market. "Quantum Forecast System" is a kind of artificial intelligence prediction system, which adheres to the international advanced quantitative investment concept and is used for financial forecasting.
Its main use is the intelligent computer system, uses the unique "Quantum Finance Forecast Technology", transforms the market data and the technical index to the international major financial product daily and the weekly forecast high and low index, and corresponding quantification price and the corresponding computer strategy. The daily Forecast index defines the range of possible fluctuations in the day's market. In probability, the market in the vicinity of the prediction of high callback probability, in the vicinity of the forecast low rebound probability is higher. The quantification price represents different levels of energy, such as the orbits of planets in the solar system, or the orbits of electrons within atoms, as a reference to support or resistance. Using computer predictive data as a reference, the advantage is that one looks more intuitive and convenient, easier to understand its message to convey, the two can avoid subjective factors such as human judgment interference, more objective and scientific.
In general, for international financial products market, most of the time is based on technical adjustment. Therefore, we can use technical indicators to roughly determine the volatility of the day, because the indicators reflect the market supply and demand relationship. But just looking at the indicators, it is difficult to know the range of price fluctuations, and at which point to enter, and easily with personal subjective conjecture.
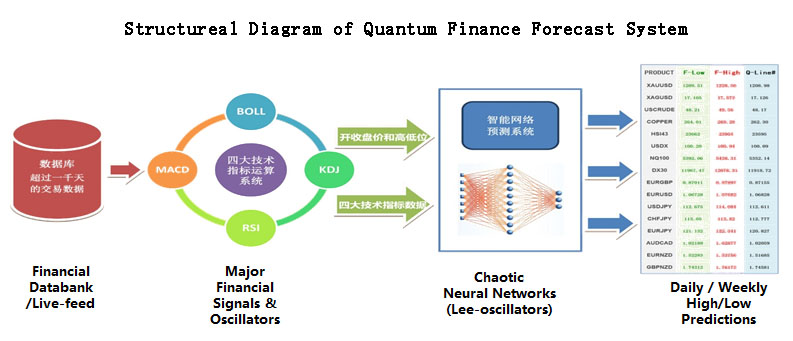
The "Quantum Finance Forecast System" is to use the computer to re-interpret the indicators, so as to avoid the interference of subjective factors. From the point of view of system structure, it makes use of more than 2000 days of trading data (including daily opening, closing price and high and low level), combined with the four major technical indicators (BOLL, KDJ, MACD and RSI), through the integration with Dr. LEE invented Chaotic Neural Networks, the QFFS automatically calculate the day's quantitative prediction index, That is, the four indicators and the overall forecast level.
Using these indicators as a reference, the advantage is: first, look at the technical indicators more intuitive and convenient, and secondly, more easily understand the indicators to convey the information. And more importantly, know which point you can enter, which direction you should do. This is of great significance for intraday short-term operations.
Every morning, each major product as soon as the opening, the Quantum Finance Forecast Center will use the intelligent computer automatically calculate its forecast high-low range, can be said to be the earliest, most objective and scientific prediction Reference index in China.
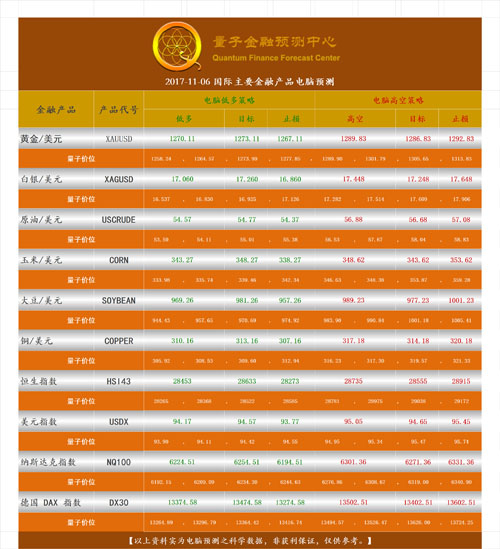

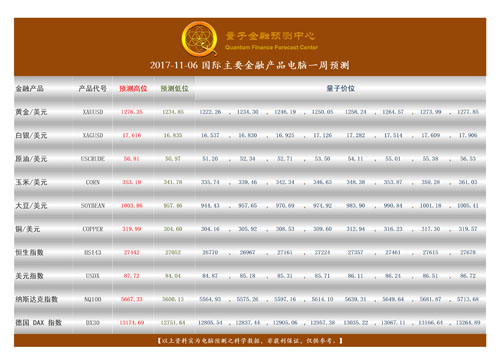
For example, the above figure is the computer forecast data for November 6, 2017. For investors who do not understand the technical indicators, just look at the forecast level. In the U.S. dollar index, for example, the indicators see the day's high level roughly in the 95.05 area, low in 94.17. If the market goes to 95.05, indicating that there is a certain technical resistance, the callback probability is larger, go to 94.17 line, there is a certain technical support, the rebound probability is larger. For those who are familiar with the technical indicators, they can get more information, but also can use the computer's prediction level and their own judgment to make a comparison.
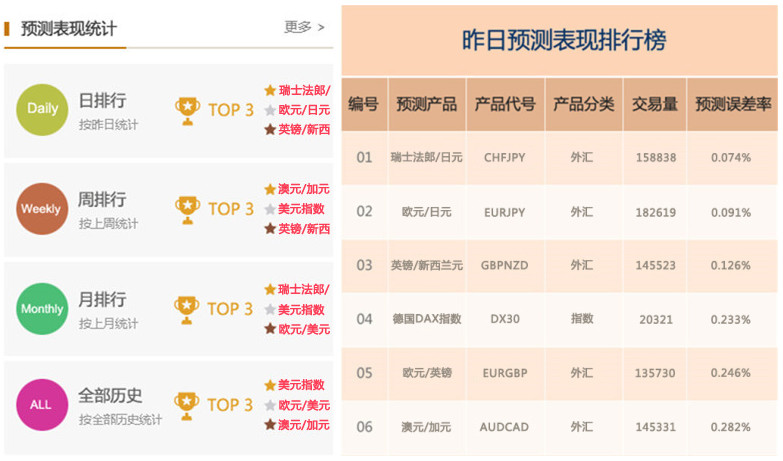
In addition, we will be the computer forecast data for different periods (daily, weekly, monthly, history) of the statistics ranking. Therefore, in addition to being able to view the quantitative forecasts and computer strategies of products of interest to them, investors can also view the products with a smaller forecast error rate by the rankings in the performance statistics (the statistical method uses international general practice, which is derived from the average error between the forecast index and the actual high and low level/the closing price and refer to its ranking to choose the type of investment.
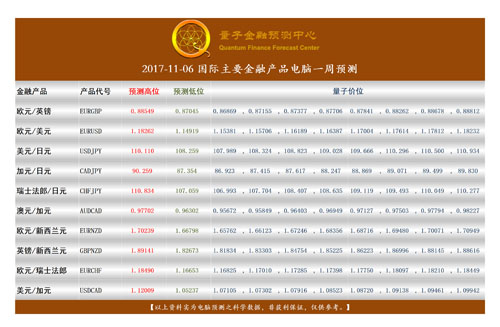
In addition to the daily forecasts, the "Quantum Finance Forecast System" also has the weekly forecast for mid-term investment. The next week's forecast is a prediction of the amplitude range of the next week, as well as the overall possible trend, for the mid-term investors to have a reference. The chart above is "forecast for the week of 2017-11-06" (The coming week, November 6, 2017 to November 10, 2017). It is normal to predict that the amplitude of the next week will be much more difficult than predicting the next day's wave range. Therefore, if we can combine the forecast of the next week and the daily forecast of the week, we can better determine the entry and exit point of trading.
The so-called practice, in the practice process, to perform well, the key lies in four conditions-time, callback, break and trade-offs, and this requires a certain experience and skills. However, if only experience and skills, but not a set of objective and scientific methods, it is difficult to achieve long-term stability. After three years of observation and statistics, we do find that the stability and accuracy of computer predictions are better than those of subjective judgment. Therefore, in the West today, the methodology of using intelligent to predict financial market will become the mainstream trend in the future.
